
Expert Insights for the Rest of the Year in Housing
Here’s what experts have to say about what lies ahead for inventory, mortgage rates, and home prices. Let's connect so you know what to expect in the housing market for the rest of the year.

A Real Estate agent that works the (Georgia) Alpharetta, Down Town Alpharetta Roswell, Cumming, Johns Creek; Milton area. Over 32 years and 1760+ Past clients. Relocation, Short Sales and Foreclosures
Here’s what experts have to say about what lies ahead for inventory, mortgage rates, and home prices. Let's connect so you know what to expect in the housing market for the rest of the year.

Today’s mortgage rates are top-of-mind for many homebuyers right now. As a result, if you’re thinking about buying for the first time or selling your current house to move into a home that better fits your needs, you may be asking yourself these two questions:
Here’s context you need to help answer those questions.
The 30-year fixed-rate mortgage is largely influenced by the supply and demand for mortgage-backed securities (MBS). According to Investopedia:
“Mortgage-backed securities (MBS) are investment products similar to bonds. Each MBS consists of a bundle of home loans and other real estate debt bought from the banks that issued them . . . The investor who buys a mortgage-backed security is essentially lending money to home buyers.”
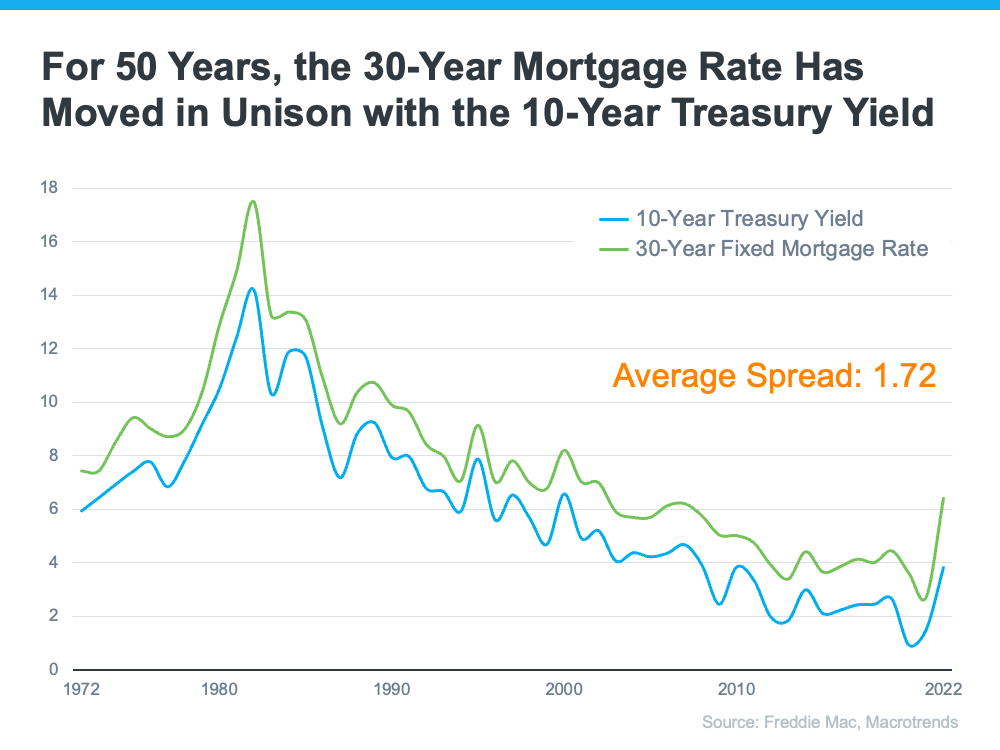
Demand for MBS helps determine the spread between the 10-Year Treasury Yield and the 30-year fixed mortgage rate. Historically, the average spread between the two is 1.72 (see chart below):
Last Friday morning, the mortgage rate was 6.85%. That means the spread was 3.2%, which is almost 1.5% over the norm. If the spread was at its historical average, mortgage rates would be 5.37% (3.65% 10-Year Treasury Yield + 1.72 spread).
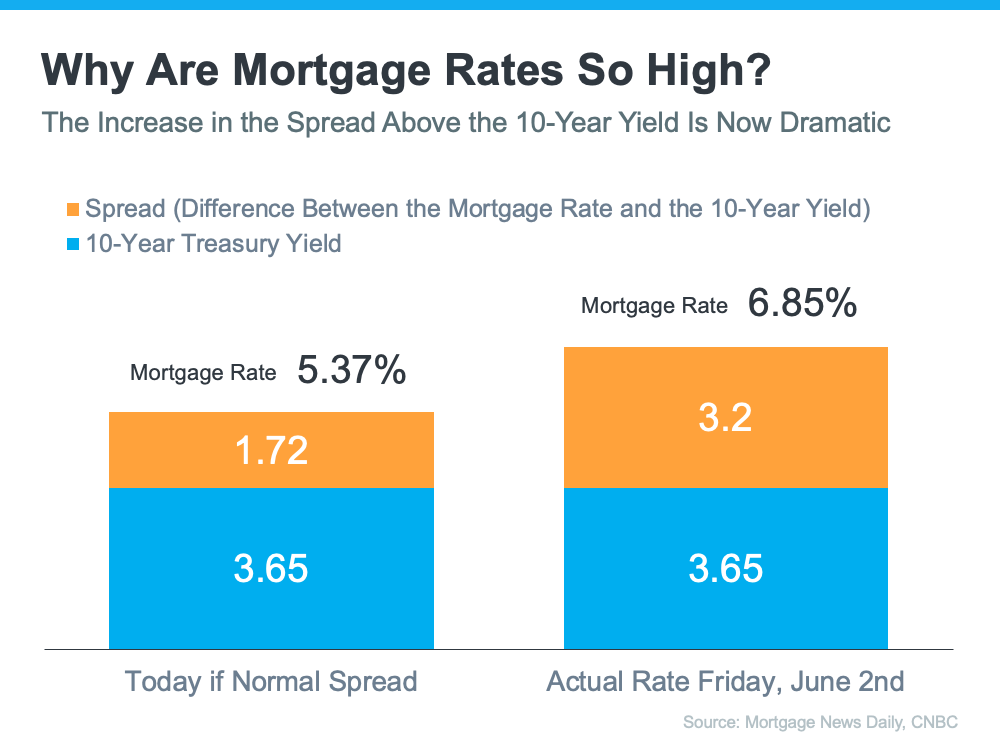
This large spread is very unusual. As George Ratiu, Chief Economist at Keeping Current Matters (KCM), explains:
“The only times the spread approached or exceeded 300 basis points were during periods of high inflation or economic volatility, like those seen in the early 1980s or the Great Financial Crisis of 2008-09."
The graph below uses historical data to help illustrate this point by showing the few times the spread has increased to 300 basis points or more:
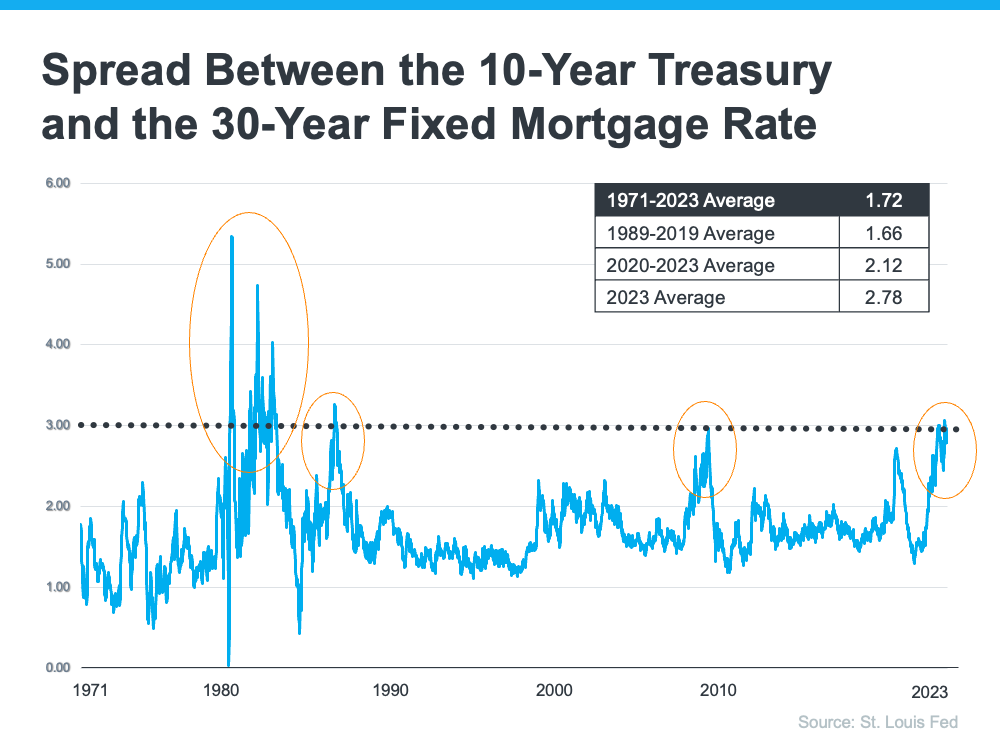
The graph shows how the spread has come down after each peak. The good news is, that means there’s room for mortgage rates to improve today.
So, what’s causing the larger spread and making mortgage rates so high today?
The demand for MBS is heavily influenced by the risks associated with investing in them. Today, that risk is impacted by broader market conditions like inflation and fear of a potential recession, the Fed’s interest rate hikes to try to bring down inflation, headlines that create unnecessarily negative narratives about home prices, and more.
Simply put: when there’s less risk, demand for MBS is high, so mortgage rates will be lower. On the other hand, if there’s more risk with MBS, demand for MBS will be low, and we’ll see higher mortgage rates as a result. Currently, demand for MBS is low, so mortgage rates are high.
Odeta Kushi, Deputy Chief Economist at First American, answers that question in a recent blog:
“It’s reasonable to assume that the spread and, therefore, mortgage rates will retreat in the second half of the year if the Fed takes its foot off the monetary tightening pedal and provides investors with more certainty. However, it’s unlikely that the spread will return to its historical average of 170 basis points, as some risks are here to stay.”
The spread will shrink when the fear investors feel is eased. That’ll mean we should see mortgage rates moderate as the year goes on. However, when it comes to forecasting mortgage rates, no one can know for sure exactly what will happen.


The National Association of Realtors (NAR) will release its latest Existing Home Sales Report tomorrow. The information it contains on home prices may cause some confusion and could even generate some troubling headlines. This all stems from the fact that NAR will report the median sales price, while other home price indices report repeat sales prices. The vast majority of the repeat sales indices show prices are starting to appreciate again. But the median price reported on Thursday may tell a different story.
Here’s why using the median home price as a gauge of what’s happening with home values isn’t ideal right now. According to the Center for Real Estate Studies at Wichita State University:
“The median sale price measures the ‘middle’ price of homes that sold, meaning that half of the homes sold for a higher price and half sold for less. While this is a good measure of the typical sale price, it is not very useful for measuring home price appreciation because it is affected by the ‘composition’ of homes that have sold.
For example, if more lower-priced homes have sold recently, the median sale price would decline (because the “middle” home is now a lower-priced home), even if the value of each individual home is rising.”
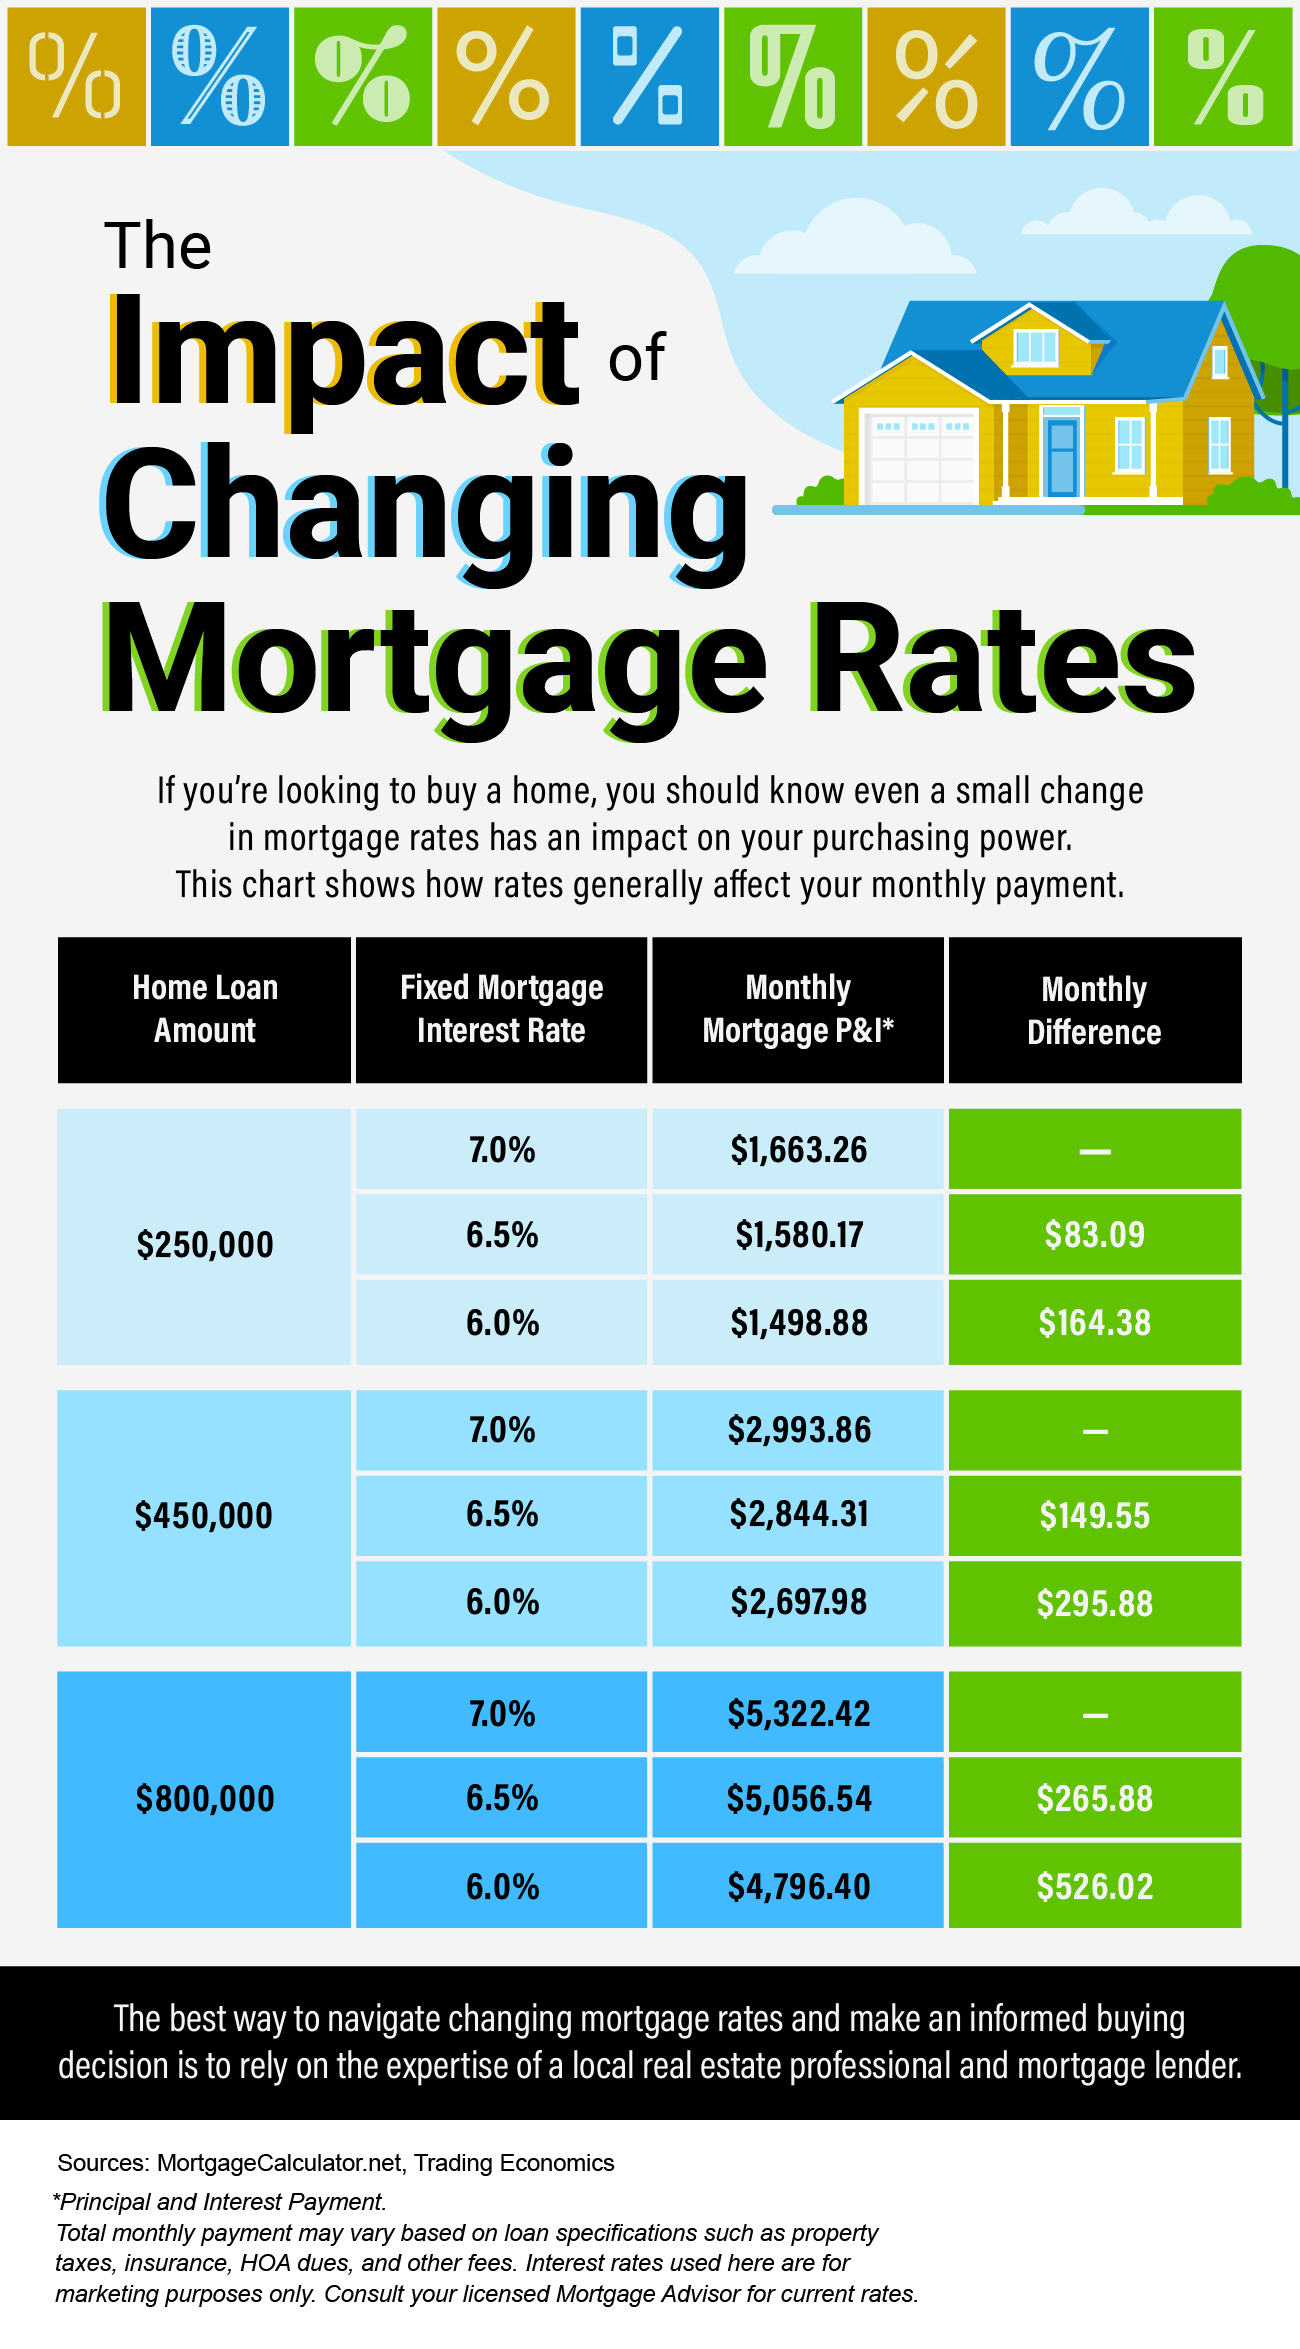
People buy homes based on their monthly mortgage payment, not the price of the house. When mortgage rates go up, they have to buy a less expensive home to keep the monthly expense affordable. More ‘less-expensive’ houses are selling right now, and that’s causing the median price to decline. But that doesn’t mean any single house lost value.
Even NAR, an organization that reports on median prices, acknowledges there are limitations to what this type of data can show you. NAR explains:
“Changes in the composition of sales can distort median price data.”
For clarification, here’s a simple explanation of median value:
The same thing applies to today’s real estate market.
Actual home values are going up in most markets. The median value reported tomorrow might tell a different story. For a more in-depth understanding of home price movements, let’s connect.

